


The Accuracy Tests
In Part 1 of this series, LOD President. Billy Martin, spent considerable time with me, familiarizing me with his equipment, getting in some informal test firing of his LOD Precision Marksman Sniper Rifle, and sharing some personal philosophy. But he was gone now … and left to myself, I intended to see just what his equipment was capable of. The truth is in the proof … or is it pudding? Both Mr. Martin and myself were interested in expediting the testing: he because the rifle was needed for his work, me because I wanted to attend his school as soon as possible. Thus the following test procedure was established.
According to my friend. Bruce Ainsworth, who runs the statistics for me, it takes a minimum of 15 samples (groups) to establish statistical significance and allow the Statistical Process Control Analysis (SPC) program to run.
But what comprises a group? A tactical shooter may only get one shot. We know, however, that a second might be required for one of several reasons. Would three be more realistic? For a tactical shooter. the most important round is the first one. In almost all cases, this would be from a clean, cold. dry barrel. Martin advertises 1/2 MOA accuracy. Without qualification, that means 5 rounds. Some think that shoot-ing 100 rounds, or some such number, in the same target is required for a statistical sample, but this has little meaning here, since it measures something that is never asked of a tactical rifle (unless, of course, someone is willing to clean and let the barrel cool between each shot of the one hundred shot sam-ple). I decided to stretch what I thought was generally required from such a rifle and use 5 round groups.
Thus 15. 5 round groups became the minimum required for a statistically significant analysis by my criteria. 1/5 MOA, or any other such statement, does not require that any bullet and load will produce that result, but only that one or some will. I decided to test using the “pretty blue box” of Lapua and a hand-load of my own design. Since groups at 100 yards do not give a predictable result of long range ability, I decided to repeat the tests at 300 yards. Later, I shot 3 groups at 500. being too curious not to. This, I might add, was a bit of a fiasco. Martin had given me a call, asking for the return of his rifle. He needed several rifles prepped and ready for a demonstration he was giving. While the idea of shooting at 500 had been less than a reality, I now felt pressured to get it done. I decided I could do it before work, which starts at 7:30 AM, if I was ready and rushed like the dickens. I placed the targets before dawn and waited for enough light to shoot. When the crosshairs could just make out the center bull shown (See Targets), I began firing. I started with the 167 Lapua, and after the first two shots could not make out the holes in the early morning light. I jumped in my explorer and drove to the backers. The two rounds just below center was the result. When I returned to the rifle, I could not bare to shoot another and spoil it. 1 switched to another target and shot the group shown, having lost count of the bullets fired. and still not being able to see clearly where they were impacting. The third target is the Lapua 170 Lock Base HPS.

But I digress. Let me return to the 100 yard line.
After thinking about it. I decided on one other test. I wanted to be sure where the first shot impacted. I decided to shoot 5 rounds, the first being in an identical target just below a 4 round group. 1 cleaned after each 5 rounds and let the barrel cool, trying to repeat the exercise that I thought might best emulate what a tactical shooter would be confronted with.
But wait a minute, let’s examine the claim: 112 MOA. This is a well established way of saying what? What does it mean to you. and does it have any mean-ing to a tactical shooter? In benchrest we call it an agg or aggregate. Generally this means 5. 5 round groups at 100 yards. Does this mean the rifle/load combination will shoot such an agg as .2, for example, at 200, 300 yards etc. A grand agg refers to 5, 5 round groups at 100, and 5, 5 round groups at 200 taken together, etc. What does it mean to state that my benchrest rifle generally aggs in the .2’s? I thought about that in regard to Martin’s advertisement of 1/2 MOA. Benchrest aggs mean essentially the same as MOA. But is this a claim for precision or for accuracy? Is there a difference? I talked to Bruce Ainsworth about the statistics he was running for me. He informed me of some things I was not aware of that we decided might be a more important indicator of performance to the tactical shooter than MOA.
Group size might help establish precision … placement might help establish accuracy. If I aim at the center of target (the little round circle on the targets I have included here) in a no wind condition, and if 1 can get the scope to center crosshairs at the intended point of impact. then what is the rifle’s ability to hit that point on each first. cold barrel shot? How far from the center is each round? When I then proceed to shoot a four round group just above the cold shot, how close does each bullet strike from the placement of the first … and from the point of intent, and what is the group size?
Let’s look at the problem from a couple of other viewpoints. If one purports 1/2 MOA, does that mean a rifle that shoots 4 shots into .1, but one of the rounds seems to always land .5 inches away? Is this a statistically different problem than simply saying that the rifle shot a .5 inch group … which might have been with no rounds ever touching (like a pin-wheel). Precision and accuracy have different definitions when viewed this way. Second scenario: Suppose that the first round hits the point of intent, what is the distance of each succeeding round from that first round? What happens if the first 3 rounds are always within .1 inch of the first round, but the last two are always .5 inch away? What if the first round is in or near the point of intent or away from it?
We decided that both precision and accuracy is important to the tactical shooter. and that some statistical analysis should be run (as well as MOA ) to determine the significance of such thinking. This is included in the analysis given below. I think you will find it an interesting study. and, in fact, substantiates the ability of the rifle better than simply noting MOA.
I asked a couple of people what they thought about the 100 yard target after the groups were completed. After some pondering, they stated that they were confused. Let me explain again. If you will refer to the LOD RIFLE TEST TARGET – 100 YARDS. you will see 32 bulls. A horizontal line separates the 167 Lapua from the 180 Sierra hand-loads. In the top bulls there are 8, 4 round groups with a single bullet hole in the bull just below. That single bullet hole is the first shot on a cold barrel. The 4 round group just above the single. is the remainder of the 5 round group. In this way, 1 could easily locate the first, cold, clean barrel shot without forgetting which one it was. The same applies to the 180 Sierra handloads in the bulls below the horizontal line. The same logic was used for the 3, 300 yard targets.
The first shot on a cold barrel tended to hit the point of intent most of the time. Those times that it did not. it was very close. On occasion, the first shot would have opened up the group, but only slightly. I put together some hand-loads which are shown as well. The rifle shot well with the first load I tried. I used a Sierra 180 Matchking, the spent Lapua brass, a 215 Federal primer (I later switched to Winchester LRP to see the affect), and 42 grains of 1MR 4060. Why’? Because that was all I had on hand and remembered that it was the only thing I could get to group decently in my brother’s .308. The load seemed to have a bit of vertical in it, and I went up to 43 grains. There is an amazing coincidence here. Note the first two 100 yards targets on the left side. The top was shot with the Lapua 167 grain factory load, and the bottom with the handload just described. Are they identical or what? Don’t ask me why, it just happened that way. I was a bit reluctant to include them both, thinking that readers might believe I had copied them.
I was very impressed with the Lapua ammunition that Martin gave me for the tests. Lapua’s attention to detail is a laudable representative of the makers of factory cartridges. I was interested in whether or not I could duplicate their accuracy with my own handloads. I therefore did not mess with any of my usual cartridge preparation: no turning of necks, no working on the primer pockets or flash holes, no weighing cases. If they could produce such accuracy without it, could I? I simply filled the cases with primer, powder, and bullet and got after it. In the table below you will find some interesting differences between their offering and mine. For example, while their runout was less than mine, my seating depth repeatability was better than theirs. The sizing die I used was purchased 30 years ago, is the cheapest possible, and has been beaten to a fare-the-well. The seating die, however, is of the benchrest variety. While I may have been able to beat the Lapua with some additional attention to my loading preparation and variation of powder, seating depth and bullet, can one speak badly of .350 consistent groups from factory ammo? I think not.
I began to have confidence that the first round was going to go where I wanted it to … and that the remaining 4 shots would either be at the same point of impact or very near it. If this were an indication of its long range ability, I expected groups at 300 yards to be in the 1.2 to 1.5 inch range and still within the circle I had designed … given calm, readable conditions. Ah, calm conditions. If only I could get some. Since we are blaming every-thing on El Nino, I might as well too. I had a tough time finding mornings when the wind didn’t blow, switching like it had something against me. You can see it in the groups on the right side of the targets at I00 yards. How does that affect the results of the statistics when deciding on a rifle’s MOA capability? … badly, you know the rifle could do better than I could.
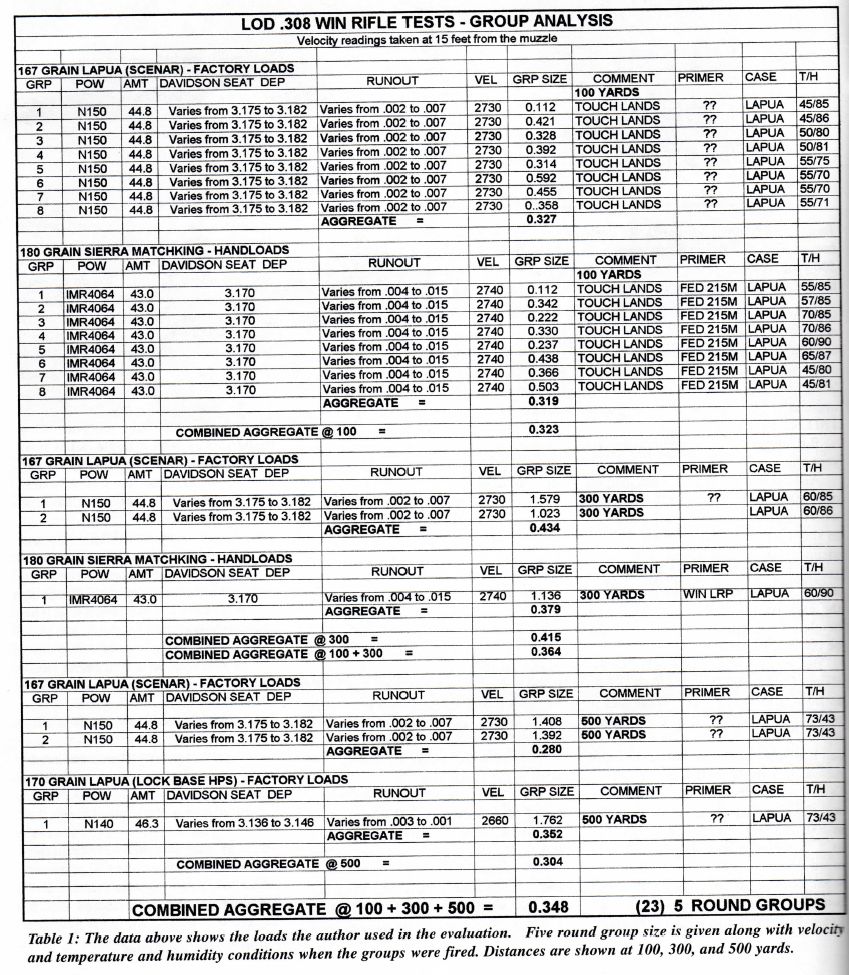
The results of my evaluation are shown below. The first table gives the loads used, together with some technical and conditional data. The powder, velocity, seating depth, and concentricity of the overall round is given, as well as the group size, temperature, and humidity. The second table is comprised of the two measurements I alluded to above, i.e. the distance of each of the final four shots from the first cold shot, and the distance from the point of intent of each shot.
Statistical Process Control Analysis (SPC)
I am sure that my explanation of this technique is growing quite old to my editor and the readers of Precision Shooting. But I feel that I must do so again for the readers of Tactical Shoot-er, since It has not previously been shown here.
SPC principles are widely used in industry to determine whether manufacturing processes are in control, and if not, how to determine that they are not, and how to get the process into control by knowing what to look for. Secondly, it often suggests methods of how to refine the upper and lower control limits under which a process is operating. The method does so by analyzing sample data statistically and then applying rules to determine performance. Thus, it takes the science of statistics one step further, applying the practical to the mathematical.
After the Second World War, an industrialist named Deming was given the job of helping the Japanese get back on their feet. The result has been astounding. One of the techniques that grew out of this effort was used extensively for quality control.
Manufacturers turn out widgets. Their questions are: what is the quality of the widgets in terms of numbers and what is the reliability of the process that turns them out? Is the process in control? Is it predictable?
One can easily calculate statistics that show normal distribution and some probability of where the next data point might fall within the sample population … if the sample size and data are statistically significant. But can statistics tell you whether the process is in control, or what the control should be, or how to control to a more strict specification, or the variability? Industry needs these answers in order to smooth and refine the process, get more from it, ascertain whether it is good or bad, and look at what the costs of controlling to a stricter process might be. It also lets you know where the process is out of control, if it is at all.
What is meant by control, in control, out of control, mean, upper and lower limits, standard deviation, histogram, process control charting? When we look at the graphs we will need to know the meaning of these terms to understand the concepts involved to understand the predictability of the performance.
Control limits can be either calculated or contrived. Software is used to make the calculations go faster. Without presetting the limits, the computer has calculated the limits for me. In the graphs, you will see the data points scattered around a center line which represents the mean of the data, This has a similar meaning to our understanding of agg or MOA. A line is shown above the data and another line below it. Their value is shown below the chart. These lines are the upper and lower control limits (ucl and Id). The values can be seen on the right or vertical axis as inches in this case. As stated before, the control limits are calculated and show the reliability of the data. I could reduce the control limit ??? or mean. However, to do so I would have to change the process. For example, change the barrel, or the powder, or the bullet, etc.. The center line (el) is the mean (similar to the agg or MOA, although not equal to it) whose value is shown below the chart as well.
The process is in control. Being in control means that the process is stable and predictable. This can partly be determined by noticing that all data points are within the boundaries of the ucl and lel. Unless the process is in con-trol, the capability to meet a specification has no meaning because the process is not predictable. A process can be in control, however, but not be capable. This would be the case when much of the data is beyond the upper and lower specification. For example the upper and lower control limits might be calculated at 1.5 inches and .2 inches respectively, but my personal specification might be only 1 inch as an upper control limit.
process is out or control. When using SPC, it is important to understand this and make use of it. In tuning your rifle and understanding the significance of your groups, this is equally important. Some of these rules are:
A. 21 data points or more are needed for best results
B. At least 15 data points are required
The process is out of control if any of the following occur:
1. 1 data point falls outside a control limit
2. 8 data points in a row are on the same side of the mean
3. 6 data points that either continuously increase or decrease in value
4. 2 data points out of 3 fall in the outer 1/3
Given these rules, my processes are in control. Five analyses were run. The first was the statistical significance of all groups fired, that is, with all cases, bul-lets, seating depths, powder charge, etc. at all ranges. The second is the 100 yard shots only. The third was taken of the distances the group shots were from the first cold shot. The distance of the second and fourth shots from the first are shown here for brevity. The fourth analysis is the distance of each shot from the point of intent, i.e., the center, which was also the point of aim. For those samples meeting criteria B above, a histogram is included to show normal distribution and standard deviation.
Results of SPC analysis:
Refer to the graphs at the end of the article.
1. The standard deviation for all groups was very low.
2. My overall process is in control, i .e. predictable.
3. The controlled process means that the probability is very high that I will shoot .349 MOA 5 round groups with the Lapua and handloaded ammo.
4. The probability that I will ever shoot greater than .75 is so slight as to be never, given the same conditions. This is statistically correct to 99.99 percent.
5. The probability is 99.99 percent that my 4 shots following the first will hit within .25 MOA of my first cold barrel shot given the same conditions. To be more specific, the second shot will hit within .136 inches of the first, the fourth within .29 of the first and so on.
6. The probability is very high that my first cold barrel shot will hit .144 MOA from my point of intent. It will never hit more than .45 MOA from my point of intent. The probability that it will hit near the mean of .144 but not greater than .45 MOA from 100 to 500 yards is 99.99 percent.
7. The probability is 99.99 percent that my following 4 shots will hit within .314 MOA but not greater than .65 MOA of my point of intent given the same conditions.
8. The process tests the ability of the rifle with these components only, this shooter only, and these conditions only. The rifle and components might be capable of better.
To significantly reduce the upper and lower control limits, and to reduce the mean would require that we change the process. However, it seems neither practical nor economical to do so. The results are well within the requirements of a sniper rifle. And what does, “well within the requirements of a sniper rifle” mean? I intended to find out personally by attending Martin’s course … and I did so, the results of which will be the subject of Part 3 of this series.
LOD Precision Marksman Sniper Rifle Part 1
Accuracy Capabilities of a Modern Sniper System Part 3
Article by Jacob Gottfredson in Tactical Shooter, August 1998


